
Our Solar Energy Production

In the Summer of 2023 Alpha Laboratories made a large investment in the installation of solar panels, across the entire roof of its main HQ building, and the batteries to store the energy generated.
Over time this is predicted to provide 98% of the company's electricity usage during the summer, with the batteries feeding energy into the stock freezers and fridges overnight.
We will continue to report annually on the reduced amount of energy we draw from external resources with the introduction of our own sustainable power.
Solar Panel Update August 2024
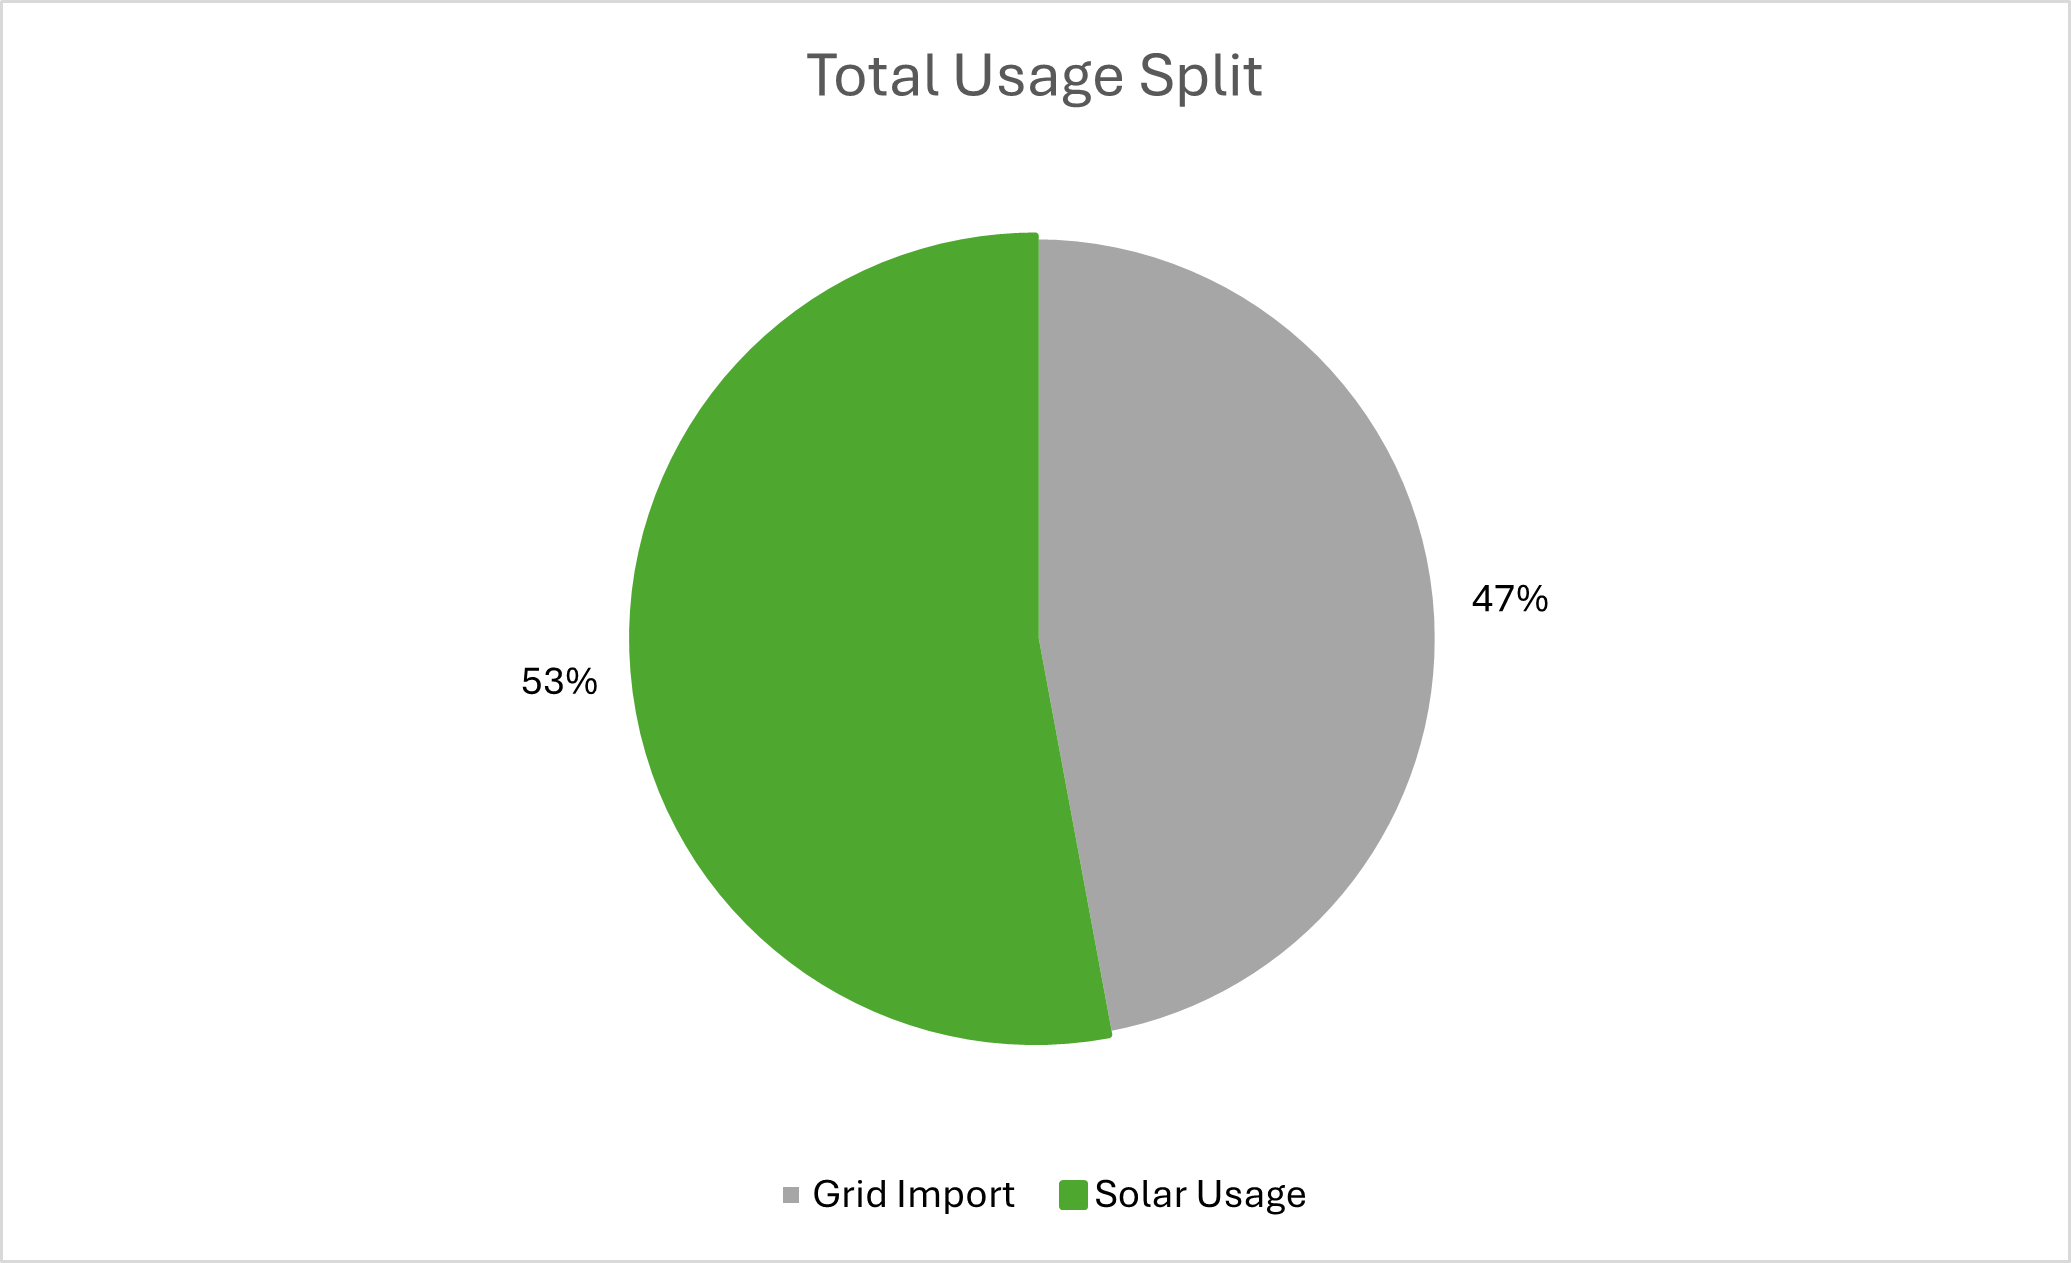
We are happy to see that using our solar panels, we have generated over 50% of the electricity needed to run our onsite operations.
Our main unit houses many of our stock storage fridges and freezers and is where our office staff are based, and we are pleased to see our solar generation here still accounts for 67% of usage.
We notice during the day a high demand for our solar generation is directed towards our EV chargers, requiring a lot of the building to feed from the grid.
This brings discussions about potentially installing more batteries to support the solar generated during low demand hours.
When we look at individual building units, we see that two of the units generate more electricity than they used. At the moment we are unable to direct that energy to demand elsewhere onsite and it is sent back to the grid.
Going forward we look to discuss potential options for harnessing this excess electricity onsite.
Please see below Alpha Laboratories' latest ~30 days update on overall energy usage (August 2024)
Solar Panel Update November 2023
October 2023 was the first full month of having all the solar panels at Alpha Laboratories up and running.
We were happy to see all all the units generating more energy than that imported from the national grid.
Overall, we generated ~50% of our consumption via the solar panels.


We will continue to monitor and record our energy usage to understand where our dependencies are within our premises.
The chart to the left shows a breakdown of our electricity generation and consumption by each building unit.